hilbertplot
The complete set of 40 two-dimensional Hilbert curves, and fast data plots on them.
- Lenguaje
- Python
- Estrellas
- 1
README
hilbertplot




The complete set of 40 two-dimensional Hilbert curves — and a fast way to plot long 1-D data on any of them.
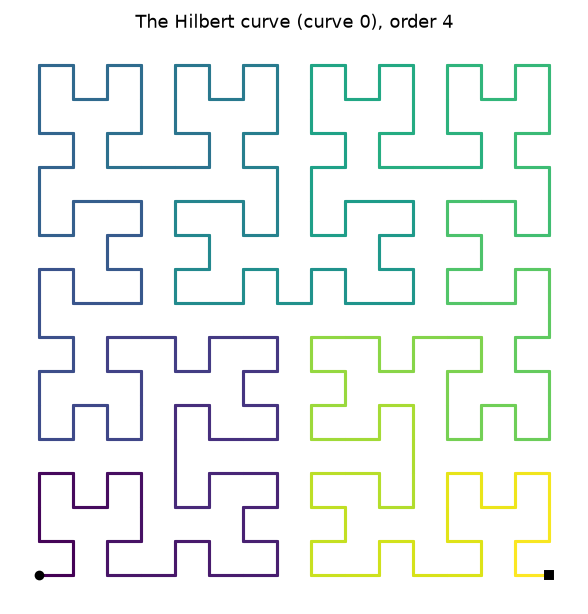
Most software knows one Hilbert curve. In fact there are forty distinct space-filling
curves of Hilbert type in two dimensions (up to rotation, reflection and reversion), as
proved by Estevez-Rams et al., "Hilbert curves in two dimensions", Rev. Cub. Fís. 34,
9 (2017). hilbertplot implements all forty with pure-numpy generation and uses them to lay
long 1-D vectors onto 2-D images.
Install
pip install "hilbertplot[plot]" # drop [plot] for a numpy-only core (no matplotlib)
Draw a curve
import hilbertplot

c = hilbertplot.curve(0)     # by index 0–39, by name ("Moore"), or by symbol
c.show(4)                    # draw order 4 in a window
pts = c.points(4)            # (256, 2) integer lattice points, in visit order
The forty curves come in named groups — hilbertplot.proper(), .improper(),
.homogeneous(), .inhomogeneous(), .generalizing() — each of which prints as a table,
and which compose:
import hilbertplot

print(hilbertplot.proper())                       # a table of the six proper curves
hilbertplot.catalog().closed().names              # ['Moore', 'Liu1', 'Improper1', 'Improper4']
hilbertplot.by_kernels(3, 5).gallery(order=3)     # draw a group as a grid of panels
In a Jupyter notebook a Curve renders itself — put hilbertplot.curve("Moore") in a cell
and you get the picture, not a repr.
One cell at a time
points(order) builds all 4**order cells. When you only need where step i lands,
encode answers in O(order) — so it works at orders no machine could materialise, and it
does so for all forty curves, not just the classic one:
import hilbertplot

c = hilbertplot.curve(0)
c.encode(5, 2)                     # (0, 3) — the cell visited at step 5, order 2
c.decode(0, 3, 2)                  # 5      — and back again
c.encode(10**18, 40)               # (751054336, 346100736) — a 2**80-cell curve
Plot data
Walk a curve and drop data[i] on the i-th cell it visits: a locality-preserving
1-D → 2-D map where nearby values stay nearby.
import numpy as np, hilbertplot

plot = hilbertplot.hilbert_plot(0, np.arange(1, 257))
plot.show("viridis")          # a matplotlib colormap name, or a list of colours to blend
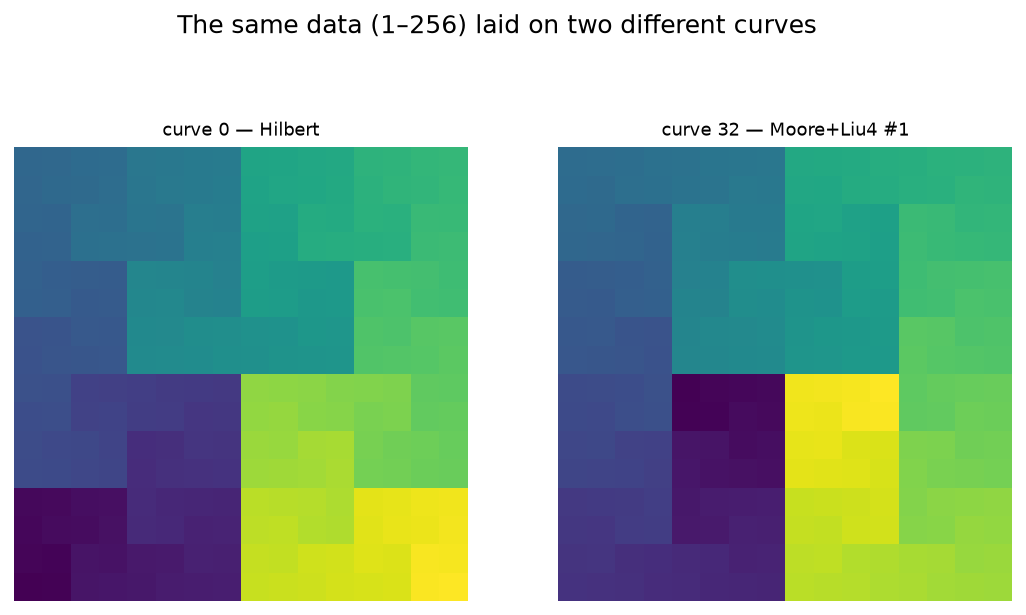
The same numbers on curve 0 and curve 32 — one reason to have all forty.
Seeing more than the data
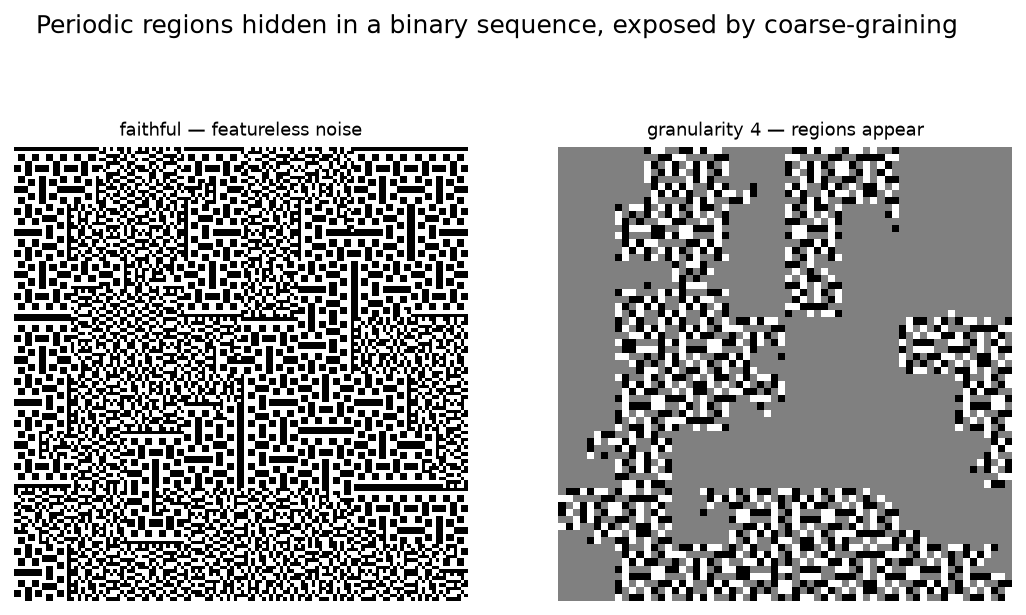
Coarse-grain it. plot.show(granularity=4) replaces each block of values by its mean.
Below, a binary sequence interleaves stretches of two periodic patterns with identical
density — invisible in the faithful plot, obvious once averaged.
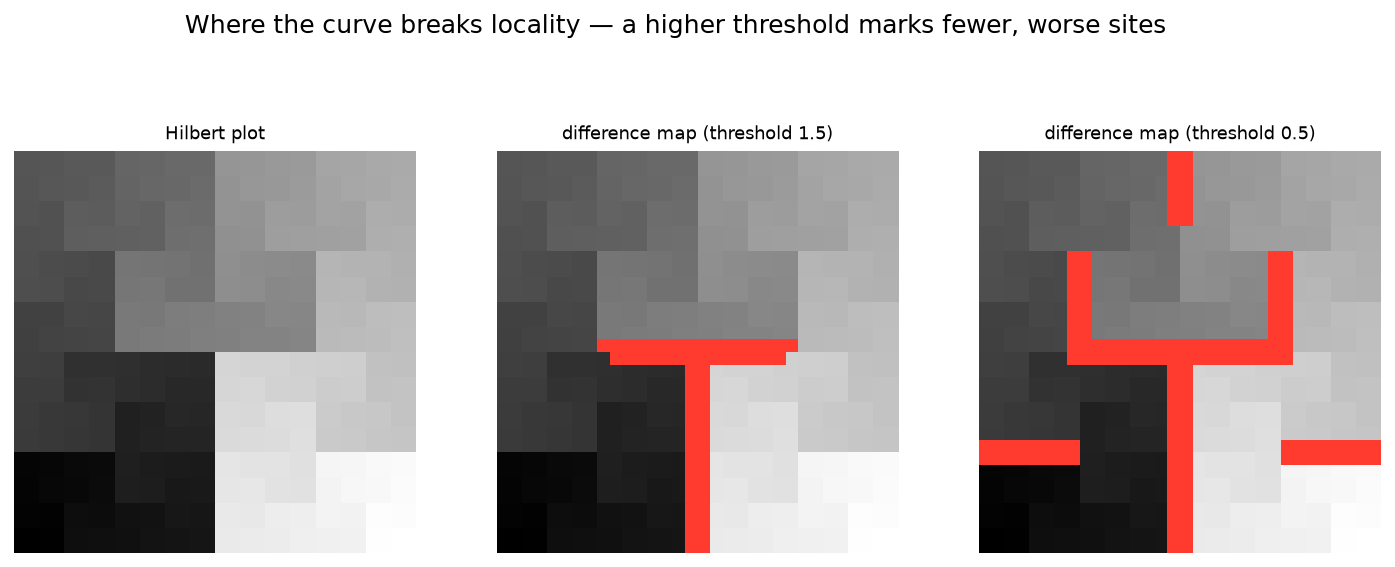
Find where locality breaks. plot.show(difference=True) marks the cells that are
neighbours in the plane but far apart along the curve. A higher threshold keeps only the
worst offenders.
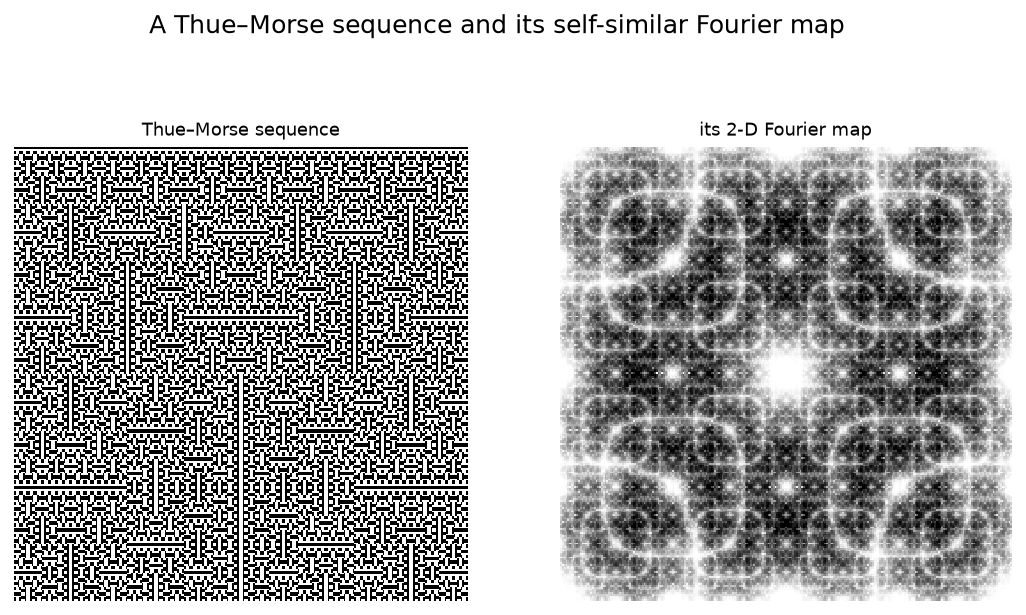
Transform it. plot.show(fourier=True) renders the 2-D Fourier map, exposing periodic
and self-similar structure — here, a Thue–Morse sequence.
Also
curve.unroll(img)— read a 2-D array back into 1-D, in curve ordercurve.grid(n)— the eightgeneralizing()curves tile anyn×nsquare, not just2ᵏcurve.label_map(order)— the grid of visit indices, as an imagecurve.difference_map(order)— where the curve breaks locality, as a fieldplot.draw(colorbar=True), ornorm=LogNorm()for heavy-tailed datahilbertplot.is_space_filling/canonical_form— check a path yourself; the same tools the test suite uses to prove all forty curves are distinct Hamiltonian pathshilbertplot.clear_cache()/cache_info()— generated curves are memoised; this frees themhilbertplot.set_cell_limit(n)— raise the guard that refuses absurdly large orders
Every figure above is reproducible: python examples/readme_figures.py. More runnable
demos are in
examples/;
the arbitrary-square classification and its impossibility proofs are in the repository's
research/quasisquares/.
License
MIT © Daniel Estevez — LICENSE
Software

ResDAG
A modern, GPU-accelerated Reservoir Computing library for PyTorch. ResDAG brings the power of Echo State Networks (ESNs) and reservoir computing to PyTorch with a clean, modular API. Built for researchers and practitioners who need fast, flexible, and production-ready reservoir computing models.

TSDynamics
TSDynamics: A Python package for defining and simulating continuous and discrete dynamical systems, including time-delay equations and maps. With a user-friendly interface for RHS definitions, it provides tools for numerical analysis and aims to integrate advanced time series analysis tools..

lzcomplexity
lzcomplexity is a high-performance C++ library developed for complexity analysis using entropic magnitudes. The library provides efficient implementations for analyzing time series data, with applications in information theory, signal processing, and neuroscience.